Top search:
A
- Accuracy Score
- Activation Function
- Algorithm
- Apache Spark
- API
- Artificial Intelligence (AI)
- Artificial Neural Networks (ANN)
B
- Backpropagation (BP)
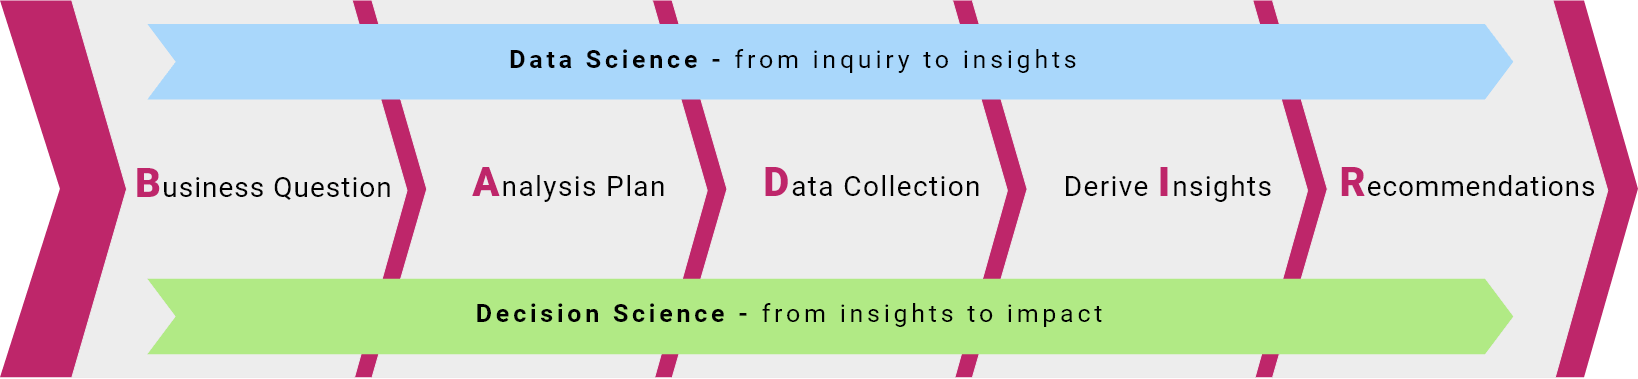
- BADIR
- Bayesian Network
- Bayes' Theorem
- Bias
- Bias-Variance Tradeoff
- Big Data
- Binomial Distribution
- Business Analyst
- Business Analytics (BA)
- Business Intelligence (BI)
C
- Categorical Variable
- Classification
- Clustering
- Computer Science
- Computer Vision
- Confusion Matrix
- Continuous Variable
- Correlation
- Cost Function
- Covariance
- Cross-Validation
D
- Dashboard
- Data Analysis (DA)
- Data Analyst
- Database
- Database Management System (DBMS)
- Data Consumer
- Data Engineer
- Data Engineering (DE)
- Data Enrichment
- Dataframe
- Data Governance
- Data Journalism
- Data Lake
- Data Literacy
- Data Mining
- Data Modeling
- Data Pipeline
- Data Science (DS)
- Data Scientist
- Dataset
- Data Structure
- Data Visualization
- Data Warehouse
- Data Wrangling
- Decision Tree
- Deep Learning (DL)
- Dimensionality Reduction
E
- EDA
- ELT
- ETL
- Evaluation Metrics
F
- False Negative (FN, Type II Error)
- False Positive (FP, Type I Error)
- Feature
- Feature Engineering
- Feature Selection
- F-Score
G
- Gradient Descent
H
- Hadoop
- Hyperparameter
- Hypothesis
I
- Imputation
K
- K-Means
- K-Nearest Neighbors (KNN)
L
- Linear Algebra
- Linear Regression
- Logistic Regression
M
- Machine Learning (ML)
- Mean
- Mean Absolute Error (MAE)
- Mean Squared Error (MSE)
- Median
- Mode
- Model Tuning
- Multivariate Modeling
N
- Naive Bayes
- Natural Language Processing (NLP)
- Normalization
- NoSQL
- Null Hypothesis
O
- Open Source
- Ordinal Variable
- Outlier
- Overfitting
P
- Parameter
- Precision
- Predictive Analytics
- Principal Component Analysis (PCA)
- Python
R
- R
- Random Forest
- Recall
- Regression
- Reinforcement Learning (RL)
- Relational Database
- Root Mean Squared Error (RMSE)
S
- Sampling Error
- SQL
- Standard Deviation
- Supervised Learning
- SVM
- Synthetic Data
T
- Target Variable
- Test Set
- Time Series
- Training Set
- True Negative (TN)
- True Positive (TP)
U
- Underfitting
- Univariate Modeling
- Unstructured Data
- Unsupervised Learning
V
- Variance
W
- Web Scraping
Z
- Z-Score
Accuracy Score
An accuracy score serves as a performance indicator for machine learning models. It reflects the proportion of predictions that align with the actual outcomes, expressed as a ratio between correct predictions and the total number of predictions made.
Activation Function
In artificial neural networks (ANN), activation functions act as gates, controlling the flow of information between neurons. They process the weighted sum of inputs from a neuron's previous layer and apply a non-linear transformation to determine the neuron's output for the next layer. This transformation introduces complexity into the network, enabling it to learn and represent intricate patterns in the data.
Algorithm
An algorithm is a step-by-step set of instructions that a computer can follow to tackle specific data science problems. These instructions are designed by humans and can range from basic calculations to intricate processes. The key strength of algorithms lies in their versatility - they can be adapted to various tasks and technologies. Fundamentally, an algorithm takes data as input and transforms it into a desired outcome. This transformation is consistent, meaning the same input always produces the same output.
Apache Spark
Apache Spark, a free and open-source software framework, tackles the challenge of analyzing and modeling massive datasets. It distributes both the data and the computations across a cluster of nodes. This distribution allows each node to handle a manageable chunk of the data, making it efficient for incredibly large datasets. Furthermore, Spark enables parallel processing in which each node tackles a subset of the calculations simultaneously. This significantly speeds up specific data processing tasks, making Spark a powerful tool for data scientists working with big data.
API
API, short for Application Programming Interface, acts as a bridge between software programs or computers, allowing them to communicate with each other. This facilitates data exchange and functionality-sharing between different applications. A common example is integrating Google Maps into a ride-hailing app.
Artificial Intelligence (AI)
Artificial intelligence (AI) is a branch of computer science focused on creating intelligent machines. It accomplishes this by drawing on techniques from machine learning, programming, and data science. AI systems come in a wide range of complexities, from basic rule-based systems to advanced machine-learning models. These intelligent systems can perform a variety of tasks, including fraud detection, object recognition, language translation, and even stock price prediction.
Artificial Neural Networks (ANN)
Artificial Neural Networks (ANNs) are machine learning models that draw inspiration from the human brain. Mimicking the brain's interconnected web of neurons, ANNs are built with layers of interconnected processing units called artificial neurons. These work together to pass information through a series of calculations influenced by activation functions. ANNs typically have three key layers => an input layer that feeds data into the network, hidden layers responsible for the heavy lifting of information processing, and an output layer that delivers the final results. This layered architecture empowers ANNs to learn complex relationships within data, enabling them to make impressive predictions. ANNs are fundamental to deep learning, a powerful subfield of machine learning that tackles intricate tasks like image and sound recognition, object detection, and language translation.
Backpropagation (BP)
Backpropagation is an algorithm used to train deep learning models. It iteratively adjusts the weights and biases of the network based on the calculated error between the model's predictions and the actual targets. This error is propagated backward through the network layers, enabling the algorithm to optimize these parameters and minimize future errors.
BADIR
BADIR is Aryng's proprietary data-to-decisions framework adopted by many Fortune 500 companies for their data literacy and digital transformation initiatives. It is a structured approach to data analysis and problem-solving, designed to help data professionals systematically and efficiently address business problems using data.
Bayesian Network
A Bayesian network is a graphical model that depicts the relationships between variables in situations with inherent uncertainty. Each node in this network represents a variable, and the connections between these nodes depict how the variables influence each other. These influences are expressed as conditional probabilities, allowing the network to calculate the likelihood of various outcomes based on the evidence available. The versatility of Bayesian networks makes them valuable tools in numerous fields, including medical diagnosis, risk assessments, etc.
Bayes' Theorem
Bayes' Theorem is a cornerstone of probability theory. It's a mathematical formula used to calculate the conditional probability of an event by allowing us to determine the likelihood of event B happening, considering that event A has already occurred. Data scientists leverage Bayes' Theorem in various applications, including building Bayesian networks.
Bias
Machine learning models can be biased, which is the tendency of models to cause skewed predictions due to certain reasons. One reason is underfitting the data which happens when the model is too basic and misses the data's complexities. Another reason is algorithmic bias which occurs when the model reflects prejudices within its training data, potentially treating different groups unfairly based on factors like race or gender. Both biases result in inaccurate predictions, highlighting the importance of using diverse and unbiased training data.
Bias-Variance Tradeoff
The bias-variance tradeoff is a balancing act in machine learning that grapples with two sources of error => bias and variance. Bias reflects how well a model captures the underlying patterns in the data. High bias, like an underfitting model, might miss important details, leading to inaccurate predictions. On the other hand, variance reflects how sensitive a model is to the specific training data. High variance, often seen in overfitting models, performs well on the training data but struggles to generalize to unseen data. The goal is to find a sweet spot that minimizes both bias and variance for accurate and generalizable predictions.
Big Data
Big data describes the field of processing, treating, and extracting insights from large amounts of complex information that traditional data processing tools struggle to handle. This data comes in many forms, from text and images to sensor readings and videos (variety), and is produced at an ever-increasing rate (velocity). The sheer volume of this data necessitates new techniques to manage it, but its true worth lies in its potential to be transformed into valuable insights (value). However, not all data is created equal, and ensuring its accuracy and trustworthiness (veracity) is crucial before it can be used for reliable decision-making.
Binomial Distribution
Binomial distribution is a mathematical tool used to analyze events with two possible outcomes, like success and failure, in a finite number of independent trials. Each trial has a fixed probability of success, and the trials themselves are independent of each other. This distribution allows us to calculate the probability of obtaining a specific number of successes within a predetermined number of trials. For instance, we can use the Binomial distribution to determine the likelihood of getting 3 heads in 7 coin flips.
Business Analyst
Business analysts are data-savvy problem solvers who bridge the gap between business goals and technical solutions. Equipped with deep business knowledge, they translate complex data insights into actionable strategies that boost profitability or streamline efficiency. Their technical toolkit often includes SQL for data analysis, along with various non-coding tools for clear and compelling communication of their findings.
Business Analytics (BA)
Business analytics is the art of transforming data into actionable knowledge. It delves into historical and current data to uncover hidden patterns and trends. This deep dive empowers businesses to make data-driven decisions, anticipate future scenarios, and optimize operations for improved performance. The business analyst's toolbox encompasses various techniques, including statistical analysis, data visualization, and descriptive analytics. As the field evolves, it may also integrate predictive analytics and machine learning for even more sophisticated insights.
Business Intelligence (BI)
Business intelligence (BI) encompasses various analytical techniques like descriptive analytics, reporting, business analytics, data visualization, and statistical analysis. Its primary focus lies in descriptive analytics, providing clear insights into what has happened and what is happening now. BI utilizes user-friendly, non-coding tools like Tableau and Power BI to make data exploration accessible and insights readily available for informed decision-making.
Categorical Variable
A categorical variable, also called a qualitative or nominal variable, sorts data points into distinct categories that represent qualities or classifications, not numerical values. There's no inherent order between the categories, unlike ranked data. For example, marital status (married, single, divorced) is a categorical variable. Each category describes a distinct state, and the order you list them doesn't affect their meaning.
Classification
In supervised learning, classification tasks involve training a model to predict categories based on given data. Classification algorithms learn from examples to assign new data points to the most fitting category. Common applications include fraud detection (identifying suspicious transactions) and spam filters (sorting emails into spam or inbox). Some popular classification algorithms include k-nearest neighbors, decision trees, and random forests.
Clustering
Clustering, in unsupervised learning, groups data points into categories (clusters) based on their similarities. Unlike classification, where categories are predefined, clustering algorithms discover these groups by analyzing the data itself. Elements within a cluster share common characteristics while differing significantly from those in other clusters. Popular clustering algorithms include k-means, which sorts data points into clusters based on their distance from a central point (centroid), hierarchical clustering, which builds a hierarchy of clusters by iteratively merging or splitting groups, and spectral clustering, which groups data points by analyzing their similarities through graph construction and dimensionality reduction.
Computer Science
Computer science encompasses the theory and practice of processing information in digital computers. It involves designing hardware and software, creating algorithms and data structures, and exploring applications like artificial intelligence, data modeling, security, and network design.
Computer Vision
Computer vision equips machines with the ability to interpret and understand visual data (images and videos) at an advanced level. Deep learning and vast datasets have fueled the recent surge in computer vision applications, like facial recognition, self-driving cars, motion analysis, and object detection.
Confusion Matrix
A confusion matrix offers clarity in binary classification scenarios (problems with two categories). This table acts like a scorecard, representing the number of accurate predictions versus actual labels for both classes. The 2x2 table classifies the model's predictions into four categories. True positives represent correct classifications, while true negatives highlight the model's ability to avoid mistakes. False positives occur when it mistakenly flags something normal, while false negatives happen when it misses something important. By analyzing this breakdown, data scientists can diagnose the model's strengths and weaknesses, paving the way for improvements and ensuring the model classifies information more accurately in the future.
Continuous Variable
A continuous variable represents a measurable characteristic that can take on any value within a specific range. Unlike categorical variables with distinct categories, continuous variables exist on a spectrum. Examples include height, weight, temperature, and distance.
Correlation
Correlation examines how two variables move together, without implying a cause-effect relationship. It's a statistical measure captured by a correlation coefficient, or Pearson coefficient, which is measured by the ratio of the covariance of two variables to the product of their standard deviations, and ranges from -1 to 1. A coefficient close to 1 indicates a strong positive correlation, meaning when one variable increases, the other tends to increase as well. Conversely, a coefficient close to -1 suggests a strong negative correlation, where an increase in one variable is linked to a decrease in the other. A value near zero signifies little to no correlation.
Cost Function
In machine learning, a cost function measures how well a model's predictions match reality. It calculates the average difference between the model's forecasts and the actual values. The goal is to minimize this cost function, essentially training the model to get as close as possible to making perfect predictions.
Covariance
Covariance measures how two variables move together. It's a statistical tool that is used to calculate a correlation coefficient and show whether changes in one variable tend to be accompanied by changes in the other variable. Unlike variance, which focuses on the spread of a single variable, covariance examines the interconnectedness of variables.
Cross-Validation
Cross-validation is a technique in machine learning used to evaluate a model's generalizability to unseen data. It works by splitting the available data into multiple sets. In each iteration, the model is trained on one of the training sets and tested on one of the remaining test sets. This process is repeated multiple times, with each set being used as a test set exactly once. Finally, the performance metrics from each iteration are used to provide a more robust estimate of the model's accuracy on unseen data.
Dashboard
Dashboards are digital information hubs that visually present essential metrics (KPIs and progress trackers) and data related to business processes. Designed for easy understanding, dashboards allow users to grasp critical information at a glance. These tools are often built using user-friendly software like Tableau, Excel, or Power BI, or coding tools like Python or R, and can be linked to constantly update with fresh data.
Data Analysis (DA)
Data analysis involves sifting through raw data, cleaning it up, and transforming it into a usable format. Analysts then use various techniques to visualize the data, uncover hidden patterns, and extract meaningful insights. These insights are then communicated to stakeholders for informed decision-making. Data analysis often forms the foundation of data science projects, but it can also be a standalone process focused on understanding existing data.
Data Analyst
Data analysts specialize in cleaning, analyzing, and visualizing data to extract meaningful insights. They leverage their technical expertise to uncover patterns and trends within the data and then communicate these insights using a blend of coding and non-coding tools, helping stakeholders make data-driven decisions.
Database
A database stores data in a structured format, typically using tables with rows and columns. This organization allows for efficient access and retrieval of specific information. Databases are often managed by relational database management systems (RDBMS) like Oracle or PostgreSQL. SQL (Structured Query Language) is the most common way to communicate with a database and query its contents.
Database Management System (DBMS)
A database management system (DBMS) is a software program that oversees all interactions with a database, ensuring data is organized efficiently (often in tables), readily accessible for retrieval, and modifiable when needed. There are various DBMS architectures, like relational (data stored in interconnected tables), hierarchical (data organized in a parent-child structure), and graph (data structured around relationships between entities). Some well-known DBMSs include Oracle, MongoDB, MySQL, and Microsoft SQL Server.
Data Consumer
Data consumers come from various backgrounds and may not have technical expertise in data analysis. However, they rely on data insights and analytics provided by data professionals to make informed decisions. This collaboration requires data consumers to understand the limitations of data and ask critical questions to ensure its suitability for answering specific business needs.
Data Engineer
Data engineers design, build, and maintain the pipelines that collect raw data from various sources. This data can be messy and unorganized, but data engineers clean, transform, and store it in a centralized location. Their goal is to ensure data scientists and analysts have high-quality, readily accessible data for their projects, empowering them to extract valuable insights.
Data Engineering (DE)
Data engineering focuses on scaling the access of data within an organization. It involves the setting up of a steady flow of high-quality data by tackling issues related to data acquisition, storage, and transformation. By building data pipelines and cleaning up raw data, data engineering makes data usable for data scientists and analysts who extract valuable insights.
Data Enrichment
Data enrichment is the process of adding valuable details to existing data to make it more insightful. By enriching data through enhancement, refinement, and augmentation, organizations can unlock deeper business insights and improve the accuracy of their predictive models.
Dataframe
DataFrames are tabular data structures used for organizing and analyzing data, commonly found in programming environments. They resemble a table or spreadsheet, consisting of rows and columns, where each column typically represents a variable or feature, and each row represents an observation or data point.
Data Governance
Data governance refers to a set of principles, practices, and processes that ensure the high quality, security, and availability of data within an organization. It involves planning, overseeing, and controlling how data is managed, ensuring its quality, security, and usefulness. This includes defining roles and responsibilities for handling data, establishing clear guidelines (like data quality standards and security protocols), and implementing a program to put these practices into action. Ultimately, data governance helps organizations get the most out of their data by making it reliable, secure, and accessible to everyone who needs it.
Data Journalism
Data journalism goes beyond traditional reporting by using large datasets and statistical analysis to uncover insights and tell data-driven stories. It emerged in response to the growing importance of data in the modern world, requiring journalists to incorporate skills from statistics, information technology, and even data science into their work.
Data Lake
A data lake is a central repository that holds a vast collection of raw data in its original format. This data can come from diverse sources and include structured formats (like databases) and unstructured formats (like text files or social media). Unlike data warehouses, data lakes don't require pre-defined structures or purposes for the data. The raw data is stored for future use, allowing for flexible exploration and analysis when specific needs arise.
Data Literacy
Data literacy empowers people to read, analyze, communicate, and reason using data. This skill is crucial for making informed decisions based on evidence, not just gut feeling. On an organizational level, data literacy encompasses a range of abilities, from basic data comprehension to advanced data science skills. The goal is to equip everyone with the tools they need to unlock the value of data and drive better decisions.
Data Mining
Data mining involves collecting data from various sources, cleaning it up, and then sifting through it to find hidden patterns and connections. These patterns can be anything from customer trends to market risks. Data miners use a variety of tools, like statistics and data visualization, to uncover these insights and communicate them to decision-makers. Ultimately, the goal of data mining is to help organizations make better choices based on data, not just guesswork.
Data Modeling
Data modeling involves visually representing how data flows within a system, highlighting connections between different data points. This blueprint shows what kind of data is stored, how it's organized, and how it relates to each other. In data science, data modeling takes on an additional role => building reliable structures that transform raw data into usable insights. By understanding business needs and available data, data models provide a roadmap for data-driven decision-making.
Data Pipeline
A data pipeline automates the movement of data throughout an organization. It's a series of connected steps that take raw data, clean and transform it, and deliver it to its final destination (often a data warehouse or data lake) ready for analysis. This automation ensures a steady flow of high-quality data, empowering data scientists and analysts to focus on extracting valuable insights.
Data Science (DS)
Data science is a field that uses a blend of analytics techniques, predictive modeling algorithms, and other technical and non-technical skills to uncover hidden patterns and insights from data. Often requiring industry knowledge, data science involves sifting through massive datasets, solving problems, and answering complex questions that can benefit businesses and organizations in many areas.
Data Scientist
Data scientists use coding skills and advanced tools to analyze massive datasets and uncover hidden patterns. These patterns can provide valuable insights that help businesses make better decisions. Data scientists are also great communicators, translating complex data findings into clear and understandable terms for non-technical audiences. They often have expertise in machine learning, a powerful technique for solving problems and making predictions from data.
Dataset
A dataset is a collection of data points, like numbers or text, that can come from various sources. This data is often organized in a table format, with columns representing different categories (like age or location) and rows representing individual entries. Datasets are like gold mines for data analysis and modeling, allowing researchers and analysts to uncover patterns and trends.
Data Structure
Data structures are ways to arrange information efficiently by keeping your data sorted in a specific format. Not only does this determine how data is organized and what you can do with it, but it also makes it easier to access and use the data you need, whether you're working with lists, tables, or other common structures.
Data Visualization
Data visualization is a way of taking complex information and transforming it into charts, graphs, and other visual formats that are easier to understand. For example, to explain a sales trend, a line chart will show that story more clearly compared to a long table of numbers. Data visualization can use maps, histograms, bar charts, and more, and can even be combined into dashboards or infographics. The goal is to make data accessible and impactful for everyone, regardless of their technical background.
Data Warehouse
A data warehouse is a central location where large amounts of clean, structured, and transformed data from various sources are brought together through the ETL (extraction, transformation, loading) process. Data analysts can then easily access this information using special tools and write queries to find the information they need. This allows them to analyze the data, uncover trends, and answer important business questions.
Data Wrangling
Data wrangling, also known as data munging, involves cleaning up messy data, organizing it in a useful way, and sometimes even combining information from different sources. This transforms your data into a format that's easy to work with, allowing analysts to uncover valuable insights.
Decision Tree
A decision tree is an algorithm used to categorize things or make predictions. It works by asking a series of yes-or-no questions about different features of the data. Based on the answers, it arrives at a final decision. Decision trees are easy to understand because of their visual structure, like a real tree. They can also mimic how humans make choices, one step at a time. However, they can be a bit too good at fitting the training data, which can lead to inaccurate results on new data (overfitting).
Deep Learning (DL)
Deep learning is a type of machine learning that uses complex connections called artificial neural networks to learn from massive amounts of data, allowing them to solve complex problems like image recognition (identifying objects in photos) or even translating languages. Deep learning is a powerful tool that's behind many of the latest advancements in artificial intelligence.
Dimensionality Reduction
Dimensionality reduction in machine learning takes a large dataset with many features and reduces them to the most important ones. This helps machines learn better and avoid getting confused by too much information. When it comes to massive datasets, dimensionality reduction saves storage space, makes calculations faster, and even helps prevent a problem called multicollinearity (where features overlap too much). One popular technique for this is called Principal Component Analysis (PCA), which is a mathematical technique that retains informative components of the original features with as much variance as possible while discarding less relevant ones.
EDA
EDA stands for Exploratory Data Analysis which is the first phase of data analysis. In this phase, data analysts or data scientists explore the data to understand its basic characteristics, looking for patterns, trends, and any potential problems. This initial analysis helps them get a feel for the data and identify questions they can answer later with more advanced techniques.
ELT
ELT stands for Extract, Load, Transform. It's a different approach to data pipelines compared to ETL (Extract, Transform, Load) which would carefully clean and organize everything before putting it in the data warehouse. Instead, ELT brings everything in first (in a data lake) and then sorts it out later. This can be faster and cheaper for massive datasets, especially when you're not sure exactly how you'll use the data yet.
ETL
ETL stands for Extract, Transform, Load. This takes raw data from various sources, cleans and organizes it, and then loads it into a central repository or the data warehouse, ready for analysis. This clean and organized data empowers data scientists and analysts to uncover valuable insights and solve business problems.
Evaluation Metrics
Evaluation metrics measure how well your model performs. For example, an accuracy score tells you how often the model's predictions are correct. F1-score and recall give you a more nuanced view of performance. RMSE (Root Mean Squared Error) helps assess how close your model's predictions are to the actual values. By considering different metrics, you can choose the model that best suits your needs.
False Negative (FN, Type II Error)
A false negative occurs in machine learning models that predict two categories, like yes/no. In customer churn/stay prediction, for example, a false negative happens when the model wrongly predicts a customer will stay (negative class) but they churn (positive class). This is like missing a red flag, as the model overlooks a customer at risk of leaving. Data scientists work hard to minimize false negatives because they can be costly for businesses.
False Positive (FP, Type I Error)
False positives are mistakes made by machine learning models that predict two categories like yes/no. In a legitimate/junk email prediction, for example, a false positive occurs when the filter incorrectly identifies a legitimate email as spam (positive), sending it to the junk folder. This can be frustrating for users who miss important messages. Data scientists strive to reduce false positives to ensure efficiency.
Feature
Features in machine learning are like building blocks for predictions. They are individual pieces of measurable data that a model uses to learn and make informed guesses. For example, when predicting someone's risk of diabetes, features might be height, weight, and sugar intake. The more relevant features a model has, the better it can understand patterns and make accurate predictions.
Feature Engineering
Feature engineering is the art of prepping data for machine learning models. Data scientists use their knowledge to transform raw data points (features) into a more usable format for the model. This can involve creating new features from existing data (like calculating Body Mass Index from height and weight) or simply refining the ones they have. The goal is to give the model the clearest possible picture of the problem, so it can learn and make accurate predictions.
Feature Selection
Feature selection is the picking of the most important features for making predictions. Large datasets can have tons of data points (features), but not all are equally important for making predictions. Feature selection helps data scientists choose the most relevant ones. This keeps the model focused, avoiding unnecessary complexity. Benefits include faster calculations, less chance of overfitting (getting stuck on unimportant details), and ultimately, more accurate predictions.
F-Score
F-Score is a metric used for evaluating machine learning models. It considers two key factors => precision (finding the truly relevant results) and recall (not missing important ones). F-Score combines these two aspects into a single metric. A common version, F1-Score, balances precision and recall equally. But there are variations, including a more general form called Fβ which allows data scientists to adjust the importance of precision or recall depending on the situation.
Gradient Descent
Gradient descent is a step-by-step approach used in machine learning to improve a model's performance. It works by constantly adjusting the model's internal settings (parameters) in a specific direction. This direction is determined by a mathematical concept called the gradient, which essentially points towards the steepest downhill slope. The goal is to minimize a value called the cost function, which reflects how well the model is performing. With each adjustment based on the gradient, the cost function ideally gets smaller, indicating the model's performance is improving. This iterative process continues until the cost function reaches a minimum, signifying the model has achieved its optimal performance.
Hadoop
Hadoop is a Java-based, open-source software framework, that tackles big data challenges. It stores massive datasets across multiple computers in a cluster, handling terabytes or even petabytes efficiently. This distributed storage overcomes the limitations of single machines. Additionally, Hadoop allows parallel processing. It breaks down large data analysis tasks into smaller pieces and distributes them across the cluster. This significantly speeds up analysis compared to using a single computer. By combining storage and parallel processing, Hadoop empowers users to manage and analyze massive datasets that would be impossible with traditional methods.
Hyperparameter
Hyperparameters are the settings that define a machine learning model's architecture and learning process. Unlike regular parameters learned during training, hyperparameters require manual selection before training begins. Finding the optimal values for these parameters, often through trial and error, is crucial for achieving the best model performance. Imagine tuning the dials on a complex telescope to achieve the clearest image - that's akin to hyperparameter tuning in machine learning.
Hypothesis
A hypothesis is a well-defined proposition that provisionally explains a phenomenon of interest. Formulated based on prior knowledge and observation, a hypothesis outlines a specific relationship or cause-and-effect scenario between variables. Through carefully designed experiments or research methods, the validity of the hypothesis is evaluated and the gathered evidence either supports the hypothesis, leading to its acceptance, or refutes it, necessitating further exploration.
Imputation
Imputation is a process that tackles missing values in a dataset using statistical methods like the average (mean) or most frequent value (mode), or machine learning techniques like K-Nearest Neighbors (KNN), which predicts suitable replacements based on similar data points.
K-Means
K-means clustering is a popular technique for grouping similar data points. It starts by defining a specific number of clusters (K) and then strategically positioning central points within the data, called centroids. Each data point is assigned to the closest centroid based on its features. This process of assigning and repositioning centroids iterates until the groupings stabilize. The result is a collection of distinct clusters where data points within each cluster share more similarities in their features compared to points in other clusters.
K-Nearest Neighbors (KNN)
K-nearest neighbors (KNN) is a machine learning algorithm used for classification. It works by classifying a data point based on the labels of its closest neighbors in the training data. The number of neighbors (K) and the distance metric used to define closeness are crucial parameters that impact KNN's accuracy. Common distance metrics include Euclidean distance (straight-line distance) and Manhattan distance (taxicab geometry distance). Choosing the right metric depends on the data and can affect KNN's accuracy.
Linear Algebra
Linear algebra is a branch of mathematics that deals with structures like lines, planes, and vectors. It also explores matrices, which can be thought of as grids of numbers, and operations like addition and multiplication performed on these structures. Linear algebra plays a vital role in data science because it allows datasets and many machine learning models to be efficiently represented using matrices. This representation enables powerful mathematical manipulations that contribute to data analysis and model building.
Linear Regression
Linear regression is a statistical technique used to model relationships between variables. It's particularly useful for continuous variables, where there's a smooth flow of values. In simpler terms, it finds the best-fitting straight line that explains how one variable changes in relation to another. This allows data scientists to make predictions about the target variable based on the features (independent variables). Linear regression is widely used in various fields for tasks like price prediction or trend analysis.
Logistic Regression
Logistic regression is a statistical method that goes beyond simple "yes" or "no" predictions. It estimates the probability of an event happening, like customer churn. Unlike linear regression which predicts continuous values, logistic regression uses a specific mathematical function to classify data points into distinct categories. This makes it useful for tasks where you want to predict the likelihood of something falling into one group or another.
Machine Learning (ML)
Machine learning is a type of artificial intelligence (AI) that learns from data. It analyzes past information to recognize patterns and trends. This allows machines to make predictions, even for situations they haven't encountered before. There are two main approaches => supervised learning, where the data is labeled with the desired outcome, and unsupervised learning, where the machine identifies patterns on its own. Machine learning is used in various fields for tasks like product recommendations or spam filtering.
Mean
The mean is a central tendency statistic that represents the average value of a dataset. It is calculated by summing all the values in the set and then dividing by the total number of values. The mean provides a single number that summarizes the overall level of a dataset, but it may not be representative of all data points if the data is skewed.
Mean Absolute Error (MAE)
Mean absolute error (MAE) measures the average amount of error in a machine learning model's predictions. It calculates the difference between predicted and actual values, takes the absolute value (ignoring positive or negative), and then averages those differences across all data points. A lower MAE indicates the model's predictions are generally closer to the true values.
Mean Squared Error (MSE)
Mean squared error (MSE) measures how far off a machine learning model's predictions are from the actual values, on average. It calculates the difference between predicted and actual values, squares those differences (making them all positive), and then averages them across all data points. Lower MSE indicates the model's predictions are generally closer to the true values.
Median
The median is a central tendency statistic that represents the "middle" value in a dataset. If you sorted all the numbers from least to greatest, the median would be the number that separates the higher half of the data from the lower half. If there's an even number of values, the median is the average of the two middle numbers. Unlike the mean, the median is less sensitive to extreme values (outliers) in the data, making it a useful measure for understanding the overall level of a dataset.
Mode
The mode is the most popular value within a dataset. A dataset can have one mode, or in some cases, multiple modes if there's a tie for the most frequent value.
Model Tuning
Model tuning in machine learning involves adjusting the model's hyperparameters, which are set before training, to improve the model's performance. By carefully tweaking them, data scientists can improve the model's accuracy on new data and avoid overfitting, which happens when the model memorizes the training data too well.
Multivariate Modeling
Multivariate modeling analyzes the relationships between multiple variables (predictors) and a target variable. It goes beyond single-factor models by considering how these variables interact to influence the target. This allows for a more comprehensive understanding of the system being studied. In data science, multivariate models are used for tasks like risk assessment or sales forecasting, where multiple factors contribute to the outcome.
Naive Bayes
Naive Bayes is a family of machine learning algorithms for classification tasks based on Bayes' theorem. They work by analyzing the probability of a data point belonging to a specific category based on its features. Despite a simplifying assumption about independence between features, Naive Bayes can be effective for tasks like spam filtering or sentiment analysis, making it a popular choice for various data science applications.
Natural Language Processing (NLP)
Natural Language Processing (NLP) equips machines with the ability to understand and process spoken and written language. NLP techniques analyze unstructured text data, uncover the context and linguistic patterns, derive meaning, and even generate human-like language. This technology is used to complete many language-based cognitive tasks and is behind features like chatbots, voice assistants, sentiment analysis, and automatic translation, making it crucial for various applications that interact with human language.
Normalization
Normalization is a process that ensures all features (data points) are on a similar scale. This is important because some machine learning models pay more attention to features with larger values. By normalizing the data, all features have a fair shot at influencing the model's predictions, leading to better performance.
NoSQL
NoSQL databases offer a way to store and access non-relational (non-tabular) information compared to traditional relational databases. They use formats like documents or key-value pairs, making them well-suited for large and evolving datasets. This flexibility allows NoSQL systems to handle massive amounts of data and adapt to changing data structures, offering increased scalability and performance for specific use cases.
Null Hypothesis
The null hypothesis, denoted by H0, represents the initial assumption that there is no significant difference or relationship between the variables being analyzed. Statistical tests evaluate the validity of this assumption by analyzing collected data. If the evidence is strong enough, the null hypothesis can be rejected, suggesting a real effect exists between the variables, or confirmed, suggesting that the observations are based only on chance.
Open Source
Open source refers to software or resources with a license that grants users the freedom to use, modify, and share them. This collaborative approach fosters innovation as users can contribute improvements, leading to more stable and feature-rich tools. Open-source projects benefit from the collective effort of a global community.
Ordinal Variable
An ordinal variable is a categorical variable with ordered categories. These categories have a natural ranking system that defines their hierarchy, but the intervals between them may not be equal. An example of an ordinal variable is a satisfaction rating (very dissatisfied, dissatisfied, neutral, satisfied, very satisfied).
Outlier
An outlier is a data point that falls significantly outside the expected range of the other values in a dataset. These extreme deviations can indicate errors during data collection or the presence of unusual phenomena requiring further investigation.
Overfitting
Overfitting occurs in machine learning when a model becomes overly focused on the specific details of the training data. This can happen if the model is too complex or the training data is limited. As a result, the model performs well on the training data but struggles to generalize to new, unseen data. This is often described as a high variance on the bias-variance tradeoff.
Parameter
A parameter in machine learning is an internal value that is learned from the training data and determines how the model transforms input data into predictions. Different machine learning algorithms can have fixed sets of parameters (parametric, such as linear regression) or learn them from data in more flexible ways (non-parametric, such as k-nearest neighbors).
Precision
Precision, a key metric in machine learning, measures the accuracy of positive predictions. It focuses on the proportion of times the model identifies a positive case that actually turns out to be positive. A high precision indicates the model rarely makes false positive errors.
Predictive Analytics
Predictive analytics leverages historical data to forecast future outcomes. It employs various techniques like statistics, data mining, visualization, and machine learning to uncover patterns and trends within the data. These insights are then used to predict probabilities of future events, enabling businesses to make data-driven decisions.
Principal Component Analysis (PCA)
Principal Component Analysis (PCA) is a method for simplifying data. When there is a complex dataset with many interlinked variables, PCA identifies a smaller set of new, uncorrelated variables called principal components that capture most of the important information from the original data. This allows data scientists to analyze and model the data more efficiently by minimizing the number of features while preserving as much variance as possible.
Python
Python is an open-source, object-oriented, and versatile programming language known for its readability and ease of use. Widely used in data science, it's also popular for general-purpose programming. Python's clear syntax and extensive libraries make it a powerful tool for beginners and experienced programmers alike, and the language is constantly evolving, ensuring it remains a powerful tool for the future.
R
R is a free and open-source programming language specifically designed for statistical computing and data analysis. It is popular among data scientists due to its powerful statistical capabilities and creation of insightful data visualizations. R boasts a rich collection of tools and packages, making it versatile for various data science tasks. Widely used across different operating systems, R benefits from a strong online community for support and collaboration.
Random Forest
Random Forest is a machine-learning method for making predictions. It works by combining the strengths of multiple decision trees, resulting in a more robust and accurate model. It leverages the wisdom of a crowd of many trees by averaging the outcome of all the trees to improve prediction accuracy compared to a single decision tree.
Recall
Recall, a key metric in machine learning, measures how well a model identifies all relevant cases. It focuses on the proportion of actual positive cases the model correctly classifies. A high recall indicates the model rarely misses true positive cases.
Regression
Regression is a statistical technique used in machine learning to forecast continuous values. It analyzes the relationship between input features and a target variable, allowing the model to predict future values based on this learned connection. This makes regression useful for tasks like price prediction or trend forecasting.
Reinforcement Learning (RL)
Reinforcement learning (RL) is a unique approach in machine learning where an agent learns through trial and error by interacting with its environment. Unlike other methods, RL doesn't require labeled data. Instead, the agent receives rewards for desired actions and penalties for undesirable ones. By continuously adapting to these rewards and penalties, the agent refines its decision-making process to achieve a specific goal. RL algorithms are used in systems like video game agents and chess engines.
Relational Database
A relational database organizes data in interconnected tables. Each table stores specific information and is linked together using unique identifiers (keys). This structure allows for efficient access, retrieval, analysis, and reassembly of data from different tables, making it a popular choice for many applications.
Root Mean Squared Error (RMSE)
Root Mean Squared Error (RMSE) is a common metric used to measure the difference between predicted values and actual values in a dataset. It is calculated as the square root of the mean squared error. Unlike the Mean Squared Error (MSE), RMSE expresses the error in the same units as the data, making it easier to interpret the magnitude of the errors.
Sampling Error
Sampling error is the inherent inaccuracy that arises when conclusions are drawn about an entire population based on a limited sample. It reflects the unavoidable difference between the true value for the entire population and the value estimated from the sample data.
SQL
SQL (Structured Query Language) acts as a common language for communicating with relational databases. It is like a set of instructions that allows us to retrieve, modify, and manage data stored in these databases. Several versions of SQL exist, like MySQL and PostgreSQL, but they all share a similar core structure, making it easy to learn and use across different systems.
Standard Deviation
Standard deviation is a statistical measure that captures how spread out the values in a dataset are from their average. It is calculated as the square root of the variance. Unlike variance, which uses squared units, standard deviation uses the same units as the data itself, making it easier to interpret the magnitude of variation.
Supervised Learning
Supervised learning trains machines to learn by example. Historical data is used as a training set, and the model learns the connection between the inputs and outputs, allowing it to make predictions for unseen data. Linear regression, logistic regression, decision trees, and support vector machines are some algorithms used for supervised learning.
SVM
Support Vector Machines (SVMs) are a type of machine learning algorithm known for their effectiveness in classification tasks and regression problems. SVMs identify a separation boundary, called a hyperplane, that best divides different categories of data. This makes them well-suited for tasks like image or document classification.
Synthetic Data
Synthetic data is data that mimics real data but is entirely artificial. This fabricated data often mirrors the statistical patterns of real datasets. Its applications are wide-ranging, from protecting privacy in sensitive fields like healthcare and banking to bolstering existing datasets for improved analysis.
Target Variable
In machine learning, the target variable, or dependent variable, is the specific outcome a model is trained to predict. The data points (features) are used by the model to determine the target variable's value.
Test Set
A test set is a portion of data held back from training a machine learning model. Typically 20-30% of the data is used for testing. This unseen data allows for a more realistic evaluation of the model's performance on new information.
Time Series
A time series is a collection of data points measured at specific and equally-spaced intervals. These data points are ordered chronologically, allowing us to track how a variable changes over time, such as stock prices or temperature.
Training Set
In machine learning, a training set is a substantial portion (usually 70-80%) of the data used to develop a model. The model is exposed to this data, allowing it to learn patterns and relationships that will be tested on the test set and used for future predictions.
True Negative (TN)
A True Negative (TN) signifies a correct guess for an item that doesn't belong to a particular group. For example, when sorting emails into spam and inbox, a true negative is a non-spam email correctly classified as "not spam" by the model.
True Positive (TP)
A True Positive (TP) means the model correctly identifies an item as belonging to the positive class based on the actual data. For example, a true positive is correctly predicting spam for an email that is actually spam.
Underfitting
Underfitting arises in machine learning when a model is too basic. In this case, the model fails to learn the intricacies of the training data due to insufficient information and has a high bias. Consequently, its performance suffers on both the data it was trained on and entirely new data sets.
Univariate Modeling
Univariate modeling examines how a single variable (predictor) affects another variable. It's like looking at a cause-and-effect relationship between two things, but focusing only on one factor at a time. This technique is often used when studying data that changes over time.
Unstructured Data
Unstructured data is information that isn't organized in a neat and orderly way, unlike data in a spreadsheet with rows and columns. This kind of data can be anything from text documents and emails to images and videos.
Unsupervised Learning
Unsupervised learning is a type of machine learning where the data goes in raw and unlabeled. Instead of being told what to predict, the model hunts for hidden patterns and groupings within the data itself. This allows it to uncover interesting trends and categorize information in new ways, useful for tasks like fraud detection or automatically organizing files based on their content. K-means is one of the most commonly used unsupervised learning algorithms.
Variance
Variance reflects how much a machine learning model's performance can change based on the training data it receives. It is calculated as the average squared difference between individual data points and the average value (mean) of the entire dataset. A model with high variance is overly sensitive to the specifics of the training data. This can lead to overfitting.
Web Scraping
Web scraping automates the process of gathering specific information from websites. It works by targeting the desired data and extracting it in a structured way. This allows for efficient collection of large amounts of data from websites.
Z-Score
A z-score tells you how far a particular value is from the average (mean) of a dataset, measured in standard deviation units. Higher positive z-scores indicate values further above the mean, while lower (more negative) z-scores indicate values further below the mean. A z-score of 0 means the value is close to the average.