

What is cluster analysis?
As the name suggests, cluster analysis is the process of grouping together different objects that are similar in some aspects. In business analytics, we apply cluster analysis to group together different products, customers, or any other business entity.
In data science, we often have to cluster groups of data points similar to each other. It can help us achieve our business goals and make operations more efficient.
To carry out cluster analysis in data science, we have to give the term “similar” a specific mathematical meaning.
What would “similar” mean? “Similar” mathematically means close-by in terms of measurement. Various algorithms can use this definition to perform cluster analysis. K-means is one such algorithm.
K-means clustering
It is one of the most popular machine learning algorithms to perform cluster analysis. It has been used to perform customer segmentation, delivery optimization, topic modeling of text data, network traffic segmentation, etc.
Machine learning algorithms are of two kinds:
- Supervised algorithms: The model learns to predict answers from a given set of correct answers.
- Unsupervised algorithm: The model does not learn from correct answers. The model learns to detect new patterns from a given data set without any example of correct answers.
K-means clustering is an example of an unsupervised algorithm. It works on a basic principle – that of the closeness of distance between two data points. There is no correct label or outcome.
Understanding K-means clustering algorithm
For this algorithm to work, we first need to decide the number of clusters into which we want to group our data. Based on that, the algorithm classifies each data point into one of the clusters. All the data points in a cluster are similar to each other than to data points in different clusters.
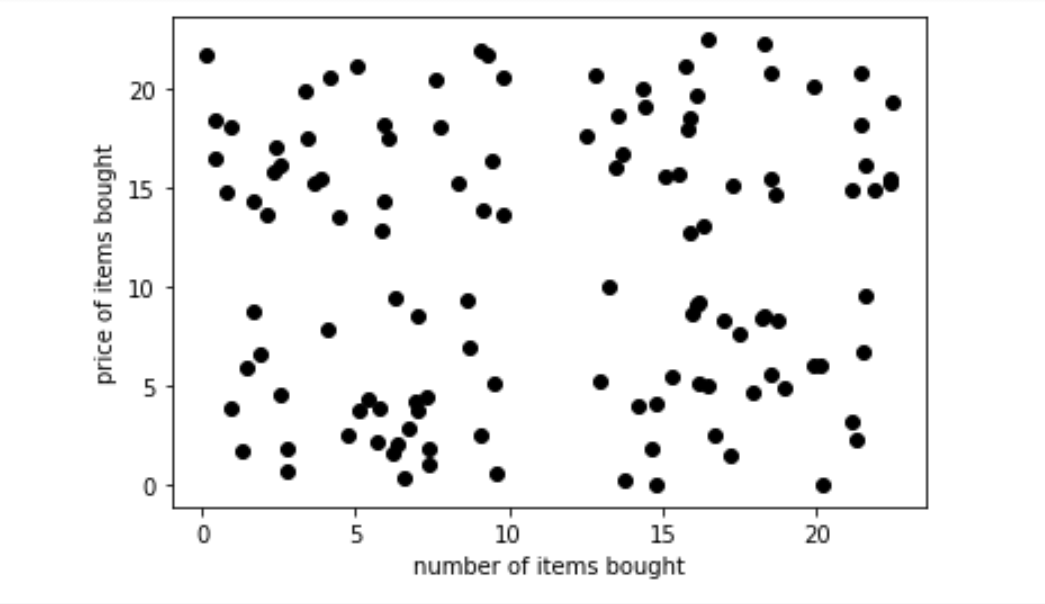
For example, let’s say we have data points about customers in a shop, with two variables:
- the price of the goods that they bought and
- the number of goods that they purchased.
When the variables are plotted against each other, they will look something like below:
Now, these customers can be grouped into separate clusters based on their buying patterns. Let’s say the marketing team wants to group them into four different clusters. We can run a k-means clustering algorithm with these data points, with k=4 (Yes! The k stands for the number of clusters!).
The result would be four different sets of data points.
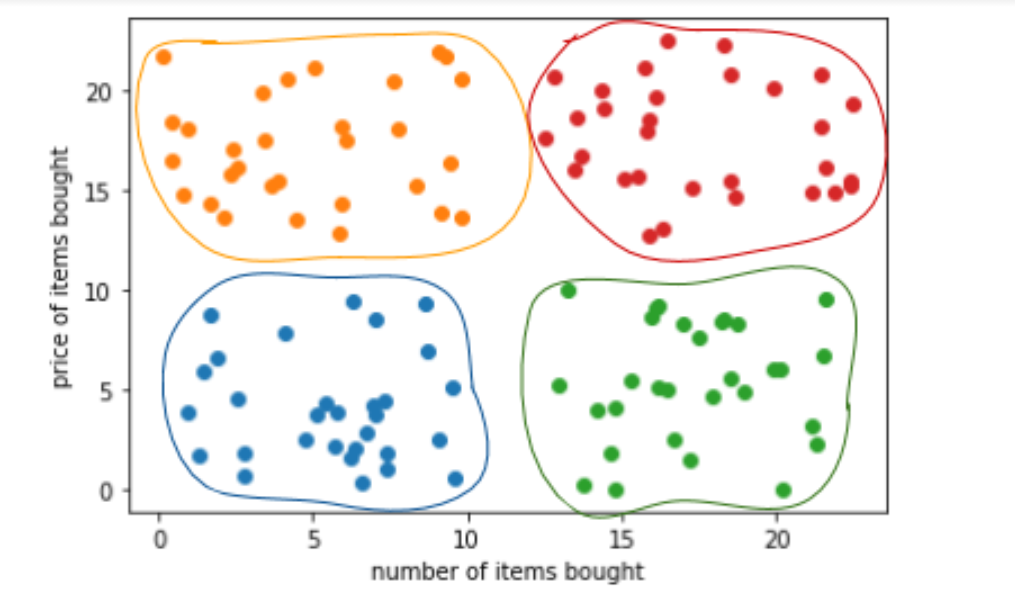
We can see the high spending cluster (seen in red) and the low spending cluster (in blue). Thus, clustering would allow us to cater to the four different kinds of customers with four different buying patterns.
This is just a small example where we had only two variables. With K-means clustering algorithms, we can cluster data points with a much higher number of variables. However, it becomes slightly tricky to visualize such clusters.
How does the K-means clustering algorithm work?
This algorithm works interestingly.
It first randomly assigns k vectors, which are called centroids. Each of the centroids represents a cluster.
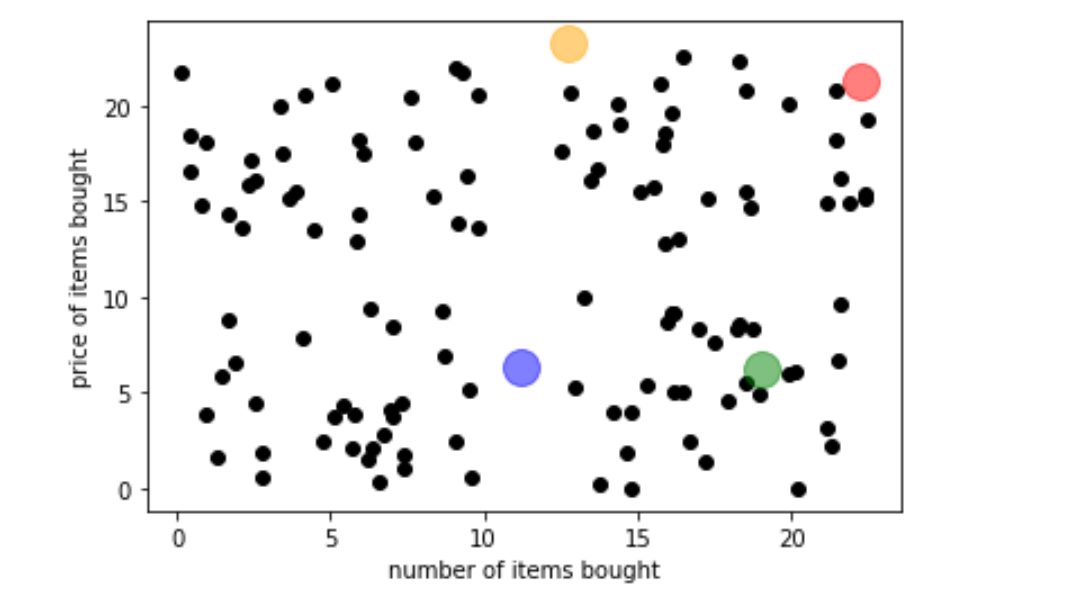
We can see the four large circles – those are the centroid vectors from clustering four groups of customers that we encountered earlier.
Once the centroids are placed, the algorithm assigns the data points closest to the centroid to its clusters.
The algorithm then moves the centroids around and keeps repeating the previous step until suitable clusters are formed. An appropriate cluster formation is where the cluster points are more similar to each other than to issues in the other clusters.
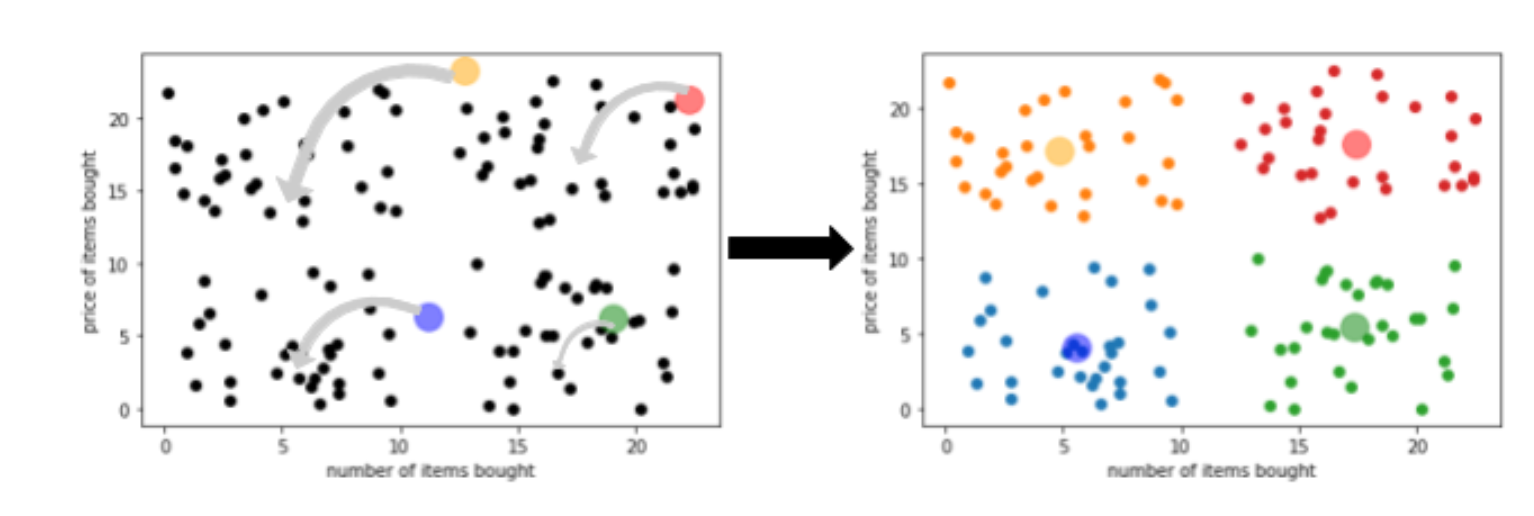
The centroids represent the vector mean of the data points – hence the term k-means clustering.
There are various ways to measure the suitability of clusters. Since clustering is an unsupervised algorithm – there are no correct answers. So the metrics for a clustering model are geared towards measuring the similarity of data points in the cluster.
Is there an optimal number of clusters for a set of data points?
In most business problems, we already know the number of clusters into which we want to group our data. But sometimes, it remains an open-ended question. In such scenarios, we would need to find an optimum number of clusters.
Since such a model’s metrics are very different from conventional metrics such as accuracy, precision, mean squared errors, etc., optimization is more complicated.
But there are various ways to decide what would be an optimum number of clusters, such as silhouette score, Davies-Bouldin index, Dunn index, etc.
You can find a detailed discussion about unsupervised algorithms and their metrics in the predictive analytics course by Aryng. It also provides hands-on training for performing cluster analysis in Python.
Business use case
K-means clustering has many business use cases. Some of the most popular implementations are:
- Customer segmentation: As we saw in the example earlier – k-means clustering has widespread customer segmentation use.
- Topic modeling: Text documents, articles, etc., often need to be grouped into respective topics. But such issues are often not available beforehand and need to create based on the data. Clustering often provides an excellent solution to such problems.
- Delivery optimization: often, the logistics of goods delivery are optimized by clustering them based on the location of delivery, timing, amount of goods, etc. K-means clustering algorithm is often used for this purpose.
Given the widespread use of this algorithm in solving business problems, it is easily one of the most sought algorithms in the world of data science.
Add a Comment