

Analysts and data scientists can face many hurdles in their work, especially when starting a new project. One such problem is working with such a large amount of data that you lose track of the goal. This happens with data scientists/analysts a lot. And it results in insights getting so messed up that the stakeholders fail to understand it. At this juncture, using a data science process is quite helpful.
A data science process allows one to navigate through the ocean of data in an organized manner. You can assess the data more carefully and remain focused, helping you avert diversions and get to the solution efficiently.
Here at Aryng, we have our own data science process, BADIR, to help us sail through any analytics project. While there are many different processes you can follow to do a project, BADIR stands out to be quite different from them. Most such frameworks focus on taking you from data to insights, but BADIR goes beyond that. While delivering insights, it shows you the impact the project will make.
What is BADIR?
BADIR is a five-step recipe-based plan to help you follow a structured approach to find the solutions efficiently. The process takes you from determining what questions to ask, through the design of your analysis, the collection of data, and data analysis, all the way to recommendations for actions to help drive impact on your business.
It is an acronym for:
- Business question
- Analysis plan
- Data collection
- Insights
- Recommendations
Using BADIR as a data science process
Let us consider an analysis done by Aryng to show you the five steps in action. The study was performed for a taxi services app, Hola (name changed).

Business Goal
The first step is to define the business goal of the data science project. It helps us understand the requirements of the stakeholders and directs the project toward the right direction.
In case of Aryng’s project for Hola, the business goal was to determine the feasibility of a new feature called safe drivers score. Hola’s product team wanted to understand driver personas and the mapping of vehicle insurance premiums for their drivers. They also wanted to understand if the safe drivers score feature would increase revenue or drive engagement. The insights needed to be presented in a month’s time.
You can notice here that the BADIR framework focuses on the 5Ws. These questions are considered basic when gathering information — who is asking for the analysis, why is he asking it, what and where are his focused market, and by when he needs the insights. Asking these questions, help us arrive at a well-defined business goal.
Also Read: Are you solving problems like Sherlock Holmes
Analysis Plan
The next step is to create a hypotheses-driven analysis plan focusing on the business goal. Based on the hypotheses, we prepare our data requirements and definitions. We then define the methodologies we need to do the analysis. This allows us to focus only on the important aspects of analysis.
A good analysis plan should consist of the following features in the given order:
- Business Goal
- Analysis Goal
- Assumptions and Definitions
- Business Hypothesis
- Data Specification
- Project Plan along with timelines
- Methodology
The business goal remains the same as defined in the first part. The next step, the analysis goal, takes a more precise form. In the case of Hola, the analysis goal was to analyze driver scores with respect to daily miles and the trips the drivers took to create their personas.
“Analyze the distribution of driver scores, trips and miles to understand insurance premium mapping. Determine the frequency at which the driver should be informed of his/her scores.”
In the assumptions and definitions section, we mention the assumptions made and define any new keywords used in the analysis plan. Doing so helps us keep the analysts and other stakeholders on the same page.
In the next step, we mention the business hypothesis along with data we need to prove and disprove the hypothesis. Following this, we specify the data definitions mentioned in the hypotheses. In the Hola case, the data specification looked something like this.
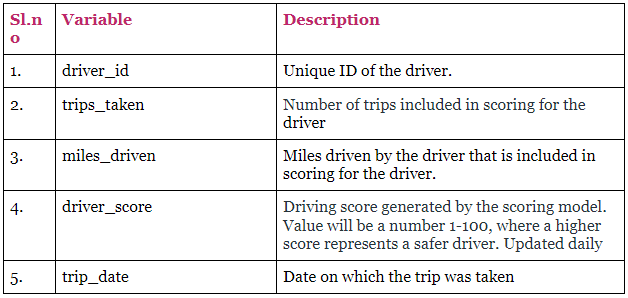
The next step allows us to keep a tab on the people involved and their role in the project. The last section focuses on the hypothesis used to do the project. In the Hola case, we used Aggregate Analysis and Correlation Analysis.
Data gathering
Now, it’s time to gather information. Since we have the business goal and an analysis plan read, we can cut through the clutter and collect data we exclusively need for the project. The data might be available on the stakeholder’s database, APIs (application programming interface) or open data sources. Here, we also decide on the tools that we need to use to perform the analysis.
In this case, we used Python to do the analysis as the amount of data needed could not be handled on Excel and Tableau.
Remember to ensure that the stakeholders are aligned with the first two steps – Business Goal and Analysis Plan – to cut down on backs and forth.
Insights
We, here at Aryng, consider this the most exciting part of a project. Here, our analysis plan meets reality. We work on our business question and use the methodology specified earlier to prove and disprove the hypothesis.
A data analysis should be performed in a very structured manner to avoid losing track of the process. First, we find patterns using univariate analysis, i.e. analyzing using one variable at a time. This method gives us a glimpse of what our dataset is all about – its uniqueness and anomalies. Also, it summarises the main characteristics of the dataset for the analyst.
After this, we look for relationships between two variables at a time using bivariate analysis. The process becomes quite intuitive from here. We then perform a multivariate analysis.
In the Hola case, we started by working with univariate distributions for driver scores, trips, and miles. Then, we looked for a change in driver scores such as a shift from the minimum to the maximum score. Doing so helped us quantify the change.
Next, we performed bivariate analysis to look into the correlation between trips and miles, trips and scores and miles and scores. In the third stage, we analysed the change in scores, trip delta and miles delta and duration between trips, etc., to find correlations and create driver personas. We used RFM Analysis to created the driver personas. The method was used to analyze customer value, on duration and count of trips and number of miles.
Recommendations
The final step of any data analytics project is presenting the insights and recommendations to the stakeholders. These findings and recommendations need to show in terms of quantified impact to guide the stakeholder accordingly. You should try to summarize the analysis on one page as everyone might not have the time to go through the whole process.
In a nutshell, in order to level up your game as a data scientist/analyst stick to a framework such as BADIR.
[…] Data Science Process: Why should you use BADIR? […]
[…] our projects use the 33-pt proprietary BADIR framework. It is a five-step recipe-based plan to help you follow a structured approach to find the […]
[…] Aryng too, we have successfully collaborated with clients from the healthcare industry. With BADIR, the AI models developed are more efficient and explainable. This is very important for healthcare, […]
[…] An all-encompassing framework that Aryng works with is called BADIR. […]